gepubliceerd in: Proceedings of the International Symposium on the History of Colonial Cartography 1750-1950, Utrecht University, The Netherlands, 21 to 23 August 2006
Antiquariaat De Wereld aan de Wand
XV
The cartographic representation
of the Netherlands East and West Indies
on Dutch school wall maps
door Lowie Brink
International Symposium on “Old Worlds-New Worlds”: The History of Colonial Cartography 1750-1950, Utrecht University, Utrecht, The Netherlands, 21 to 23 August 2006
ICA Working Group on the History of Colonial Cartography in the 19th and 20th centuries
International Cartographic Association (ICA-ACI)
From about 1820 school wall maps were one of the main teaching aids in geography lessons in primary and secondary schools in the Netherlands. Due to the growing economic importance of the Dutch East Indies, this region became a standard subject in Dutch school cartography during the second half of the 19th century. For obvious reasons the attention in geography education shifted to Netherlands New Guinea (1950 - 1962) and since 1950 to the Dutch West Indies (Surinam and the Netherlands Antilles). Various cartographic aspects of the school wall maps will be considered: map content, relief representation, map themes and map fidelity and up-to-dateness.
INTRODUCTION
Between 1750 and 1950 the image presented in school atlases and on school wall maps was for many people the only cartographic representation of the world (or parts of it) they set eyes on. In the Netherlands the image of the Dutch East and West Indies was likewise shaped by the school maps used in geography lessons. Several cartographic features of one of the main ‘builders’ of the public cartographic image of the former Dutch colonies, the school wall map, will be examined below.
MAP CONTENT
About 1820 the first school wall maps were introduced in Dutch schools. Geography was coming up as an independent science, and there was a growing demand for class teaching aids. The ‘Society for Public Welfare’, established in 1784 in the wake of the Enlightenment, played an important role in the modernization of education in the Netherlands, and was one of the first publishers of school wall maps [1]. In 1843 it was probably also the first to issue a school wall map of the Dutch East Indies. However, as a result of its small size and many details, this school map can hardly be called an effective wall map (see map extract in Figure 1). The ‘Society for Public Welfare’ can not really be blamed for this, as school wall maps that could be used at a distance were ‘invented’ only a few years earlier by E. von Sydow, one of the founders of the school cartography in Germany (‘Wandatlas über alle Theile der Erde’, 1838-1847).
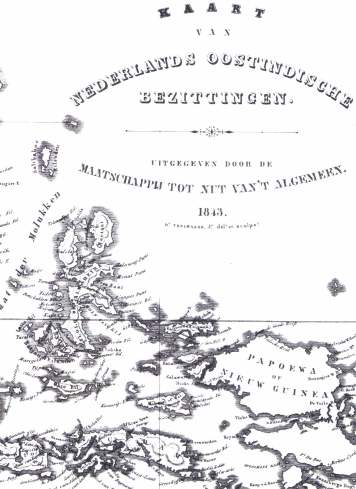
Figure 1. Map extract of ‘Kaart van Nederlands Oostindische Bezittingen’, by Dl. Veelwaard Jr., 1843, published by Maatschappij tot Nut van ’t Algemeen (‘Society for Public Welfare’), 33 x 64.5 cm, scale circa 1 : 7.000.000.
In the fourth quarter of the 19th century the first large-sized school wall maps of the Dutch East Indies appeared:
-‘Schoolkaart van Nederlandsch-Indië, op last der regeering vervaardigd door J.F.W. v.d. Willige von Schmidt auf Altenstadt’, 1877, published by C.F. Stemler, 140 x 280 cm, scale unknown;
-‘Wandkaart van Nederlandsch Oost-Indië’, P.R. Bos and R.R. Rijkens, 1881, first edition, published by J.B. Wolters, 200 x 239 cm, scale 1 : 2.000.000;
-‘Schoolkaart van Insulinde’, R. Schuiling, 1898, published by W.J. Thieme, 199 x 247 cm, scale 1 : 2.700.000 [2].
Notwithstanding their large size, these maps contain such an enormous amount of cartographic information that their effectiveness as a wall map, especially in primary schools, is questionable. The school wall map of Java by F. Allan (1876) provides another example of overloading (Figure 2). The detailed drawing and the large amount of geographic names reduce the map clarity and the usefulness as a wall map.
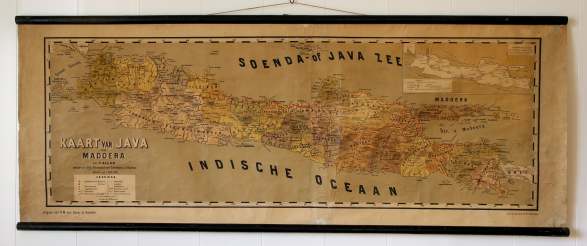
Figure 2. ‘Kaart van Java en Madoera’, by F. Allan, 1876, published by H.M. van Dorp, 64 x 174 cm, scale 1 : 700.000.
About 1900 a trend towards plain, understandable and effective school wall maps became visisble. In the textbook of H. Zondervan (1898), ‘Proeve eener Algemeene Kartografie’, which has been called the first textbook on cartography in the world [3], this new trend was expounded. A clear illustration of this development provides the ‘Schoolkaart van Oost-Indië’ by J.J. ten Have (1894; see Figure 3). The amount of cartographic information is reduced to the essential minimum. The geographic names do not interfere with the map image and are printed in such a small letter type, that this wall map seems to be unlettered at a distance. Though somewhat dull in appearance, it is in fact a very effective wall map for use as a teaching aid in geography education. The wall map of Ten Have would have to compete with several followers in the first half of the 20th century.
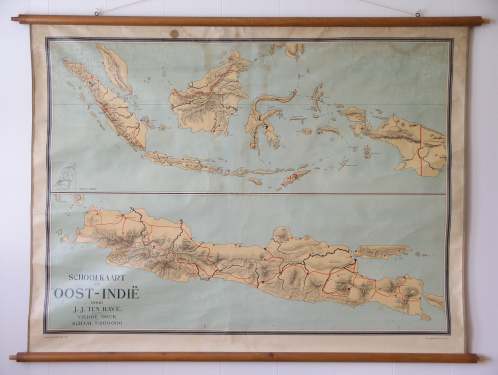
Figure 3. ‘Schoolkaart van Oost-Indië’, by J.J. ten Have, 1920, 4th edition, published by Joh. Ykema, 95 x 115 cm, scale 1 : 4.000.000.
RELIEF REPRESENTATION
Although details can often be omitted, the representation of the relief on a wall map is not easier to depict than that on a handheld map. The fact that a wall map is to be used at a distance necessitates a vivid representation of the relief. The American cartographer Raisz noted with regard to wall maps: “Mountains shown in plastic shading with deep shadows are particularly effective.” [4] Before 1950 school wall maps were usually drawn by primary and secondary school teachers with much dedication but without any cartographic training. Not surprisingly, the relief representation on these maps is therefore often simple and not realistic. An example is given in Figure 4a (‘hairy caterpillars’). There are, however, exceptions to this rule. While topographic maps were obviously its main product, the ‘Topografische Inrichting’ also issued a small number of maps for use in schools. In 1923 its counterpart in Batavia (Djakarta) published the school wall map ‘Java en Madoera’ (see map extract in Figure 4b). It is clear that the relief representation on this map was created by professionals.
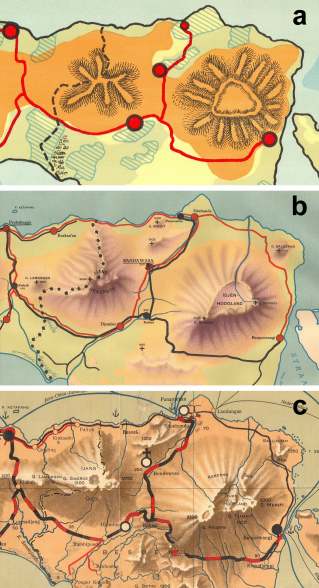
Figure 4. Most eastern part of Java. Map extracts of a: ‘Nederl. Oost-Indië’, by R. Bos and K. Zeeman, 1928, 3rd edition, published by P. Noordhoff, 108 x 136 cm, scale 1 : 3.500.000; b: ‘Java en Madoera’, 1923, published by Topografische Inrichting, 87 x 224 cm, scale 1 : 500.000; c: ‘Eenvoudige Wandkaart van Nederlandsch Oost-Indië’, by R. Noordhoff and H. Niehaus, 1915, published by J.B. Wolters, 182 x 219 cm, scale 1 : 2.750.000.
Every now and then nonprofessionals also produced relief representations that were of surprisingly high quality. Schoolmaster R. Noordhoff (not to be confused with one of the leading publishers of school wall maps P. Noordhoff) emphasized in his writings [5] the importance of the physical character of the landscape, and examined several techniques of relief representation. In 1902 he was strongly against hypsometric layers (“de schaduwzijde der Höhenschichten, made in Germany” according to the multilingual Noordhoff). However, he was an advocate of oblique hill shading, and on his school wall maps he put his opinions into practice (see map extract in Figure 4c). The fact that this schoolmaster’s representation of the volcanos of Java can compete with that of the ‘Topografische Inrichting’ (Figure 4b) is quite amazing.
THEMATIC MAPS
In the second half of the 19th century thematic maps started to appear in school atlases, and became the dominant kind of map in these atlases in the second half of the 20th century. The career of the thematic school wall map is less impressive. Only a small number of these maps were published, mainly in the 20th century, and usually without much commercial success [1]. Most school wall maps were and are still general maps or chorographic maps.
The number of published thematic school wall maps of the Dutch East and West Indies is small. They contain mainly economic or cultural themes. The economic themes are almost always depicted in auxiliary maps. The map extract in Figure 5 shows as an example the auxiliary map ‘Java Productenkaart’, which is part of the ‘Wandkaart van Nederl.-Oost-Indië’ by W. van Gelder and C. Lekkerkerker (1928). Several symbol types are used to indicate 14 products of Java:
-3 area colours;
-7 letter symbols (the initial of the name of the product);
-2 geometric symbols;
-2 pictorial symbols (for example a small grid to indicate salt pans).
Although the first edition of this wall map was published in 1881, the two economic auxiliary maps were inserted only about 1920 in a later edition under influence of the rise of economic geography. Considering the ever growing importance of economics in school geography, it seems somewhat surprising that these auxiliary maps were omitted in the ninth edition (1939). However, the insight that auxiliary maps, often unreadable at a distance, are in general out of place on a wall map also gradually emerged.
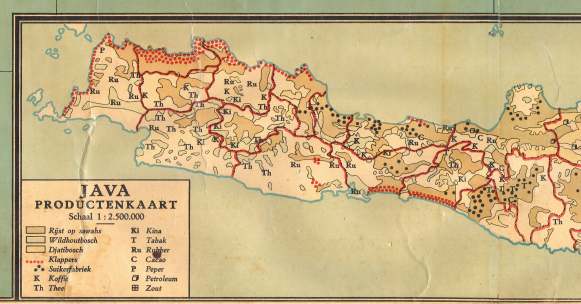
Figure 5. ‘Java Productenkaart’, scale 1 : 2.500.000. Map extract of ‘Wandkaart van Nederl.-Oost-Indië’, by W. van Gelder and C. Lekkerkerker, 1928, 7th edition, published by J.B. Wolters, 110 x 221 cm, scale 1 : 2.500.000.
School wall maps of the Dutch East Indies with cultural themes usually have the Protestant or Catholic mission work as the map subject. Occasionally only the working area of one specific missionary society is depicted, but more often the allocation of the working areas of all missionary societies in the Dutch East Indies is mapped by using area colours (for example see Figure 6). As a result of the large number of these societies, and hence the large number of colours needed, hand colouring of these wall maps, with their small impression numbers, was still practised about 1910. When comparing several mission maps, it can be deduced that, especially in the areas outside Java, the complicated distribution of working areas was changing continuously, and never reached a stable situation.
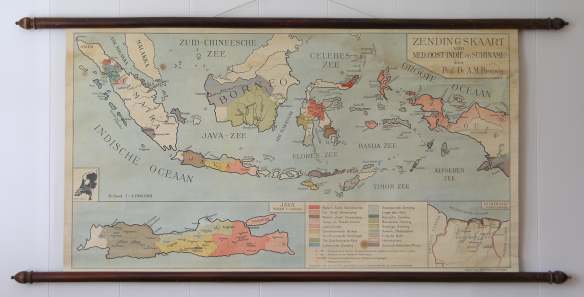
Figure 6. ‘Zendingskaart van Ned. Oost-Indië en Suriname’, by A.M. Brouwer, 1930, published by P. Noordhoff, 70 x 130 cm, scale 1 : 4.000.000.
MAP FIDELITY AND UP-TO-DATENESS
To what extent a school wall map should resemble reality has always been a point of discussion in the scholastic world. The personal beliefs and efforts of the map author, usually a school teacher, largely determined the fidelity and up-to-dateness of the school wall map. R. Schuiling, a teacher associated at a training-college, was known for his exhaustive geographic handbooks and textbooks. In agreement with this, his large-sized (5 m˛) school wall map of the Dutch East Indies (‘Schoolkaart van Insulinde’, already mentioned above in the paragraph ‘Map content’) is a comprehensive, up-to-date and as accurate as possible summary of the 19th-century cartographic achievements in the Dutch East Indies (see Figure 7). For compiling this map Schuiling used as source material a large number of individual maps, maps in books and maps in several journals (especially ‘Tijdschrift van het Koninklijk Nederlandsch Aardrijkskundig Genootschap’ and ‘Petermanns Geographische Mitteilungen’) [2].
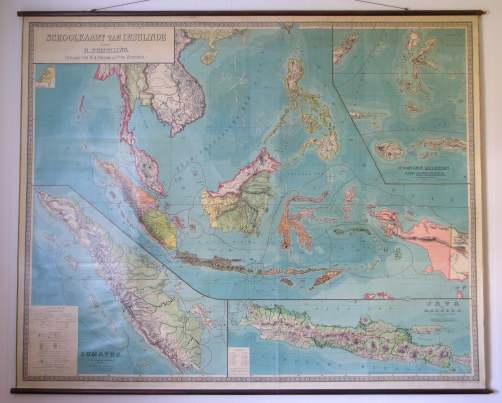
Figure 7. ‘Schoolkaart van Insulinde’, by R. Schuiling, 1898, published by W.J. Thieme, 199 x 247 cm, scale 1 : 2.700.000.
However, Schuiling’s map is not representative of other school wall maps. As the making of these maps was for most authors a secondary activity, the map fidelity and up-to-datenesss are often not optimal. Figure 8 gives an example. The four map extracts of the island Timor, taken from four school wall maps of the Dutch East Indies (period 1915 - 1933), differ significantly with regard to relief representation and the coast and boundary-lines. Furthermore, the in 1901 discovered phenomenon that the form of Timor is constricted in the middle part, is only correctly depicted on map extracts a and b. The authors of maps c and d might not have been well informed about the sudden ‘loss’ of land in Timor in 1901. It is also possible, however, they did not consider an adaptation in a new edition of the school wall map worth the costs.
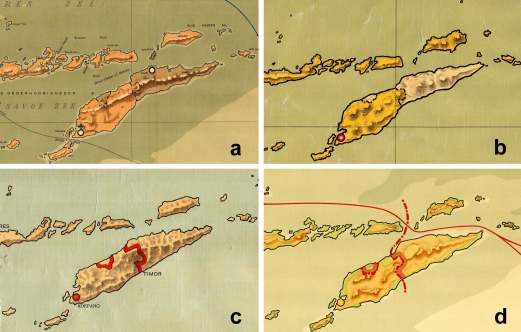
Figure 8. The island Timor. Map extracts of a: ‘Eenvoudige Wandkaart van Nederlandsch Oost-Indië’, by R. Noordhoff and H. Niehaus, 1915, published by J.B. Wolters, 182 x 219 cm, scale 1 : 2.750.000; b: ‘Schoolkaart van Nederlandsch Oost-Indië’, by G. Prop, 1929, 2nd edition, published by W.J. Thieme, 138 x 162 cm, scale 1 : 3.400.000; c: ‘Schoolkaart van Oost-Indië’, by J.J. ten Have, 1920, 4th edition, published by Joh. Ykema, 95 x 115 cm, scale 1 : 4.000.000; d: ‘Nederlandsch-Oostindië’, by A. Luinge and B. Stegeman, 1933, published by P. Noordhoff, 128 x 189 cm, scale 1 : 2.750.000.
NETHERLANDS NEW GUINEA
Due to the independence of Indonesia in 1949 (1945) the western part of New Guinea suddenly became the sole representation of The Netherlands in this region. Whereas school wall maps of Netherlands New Guinea were non-existent before 1950, after that they were the only kind of school wall map of the region published.
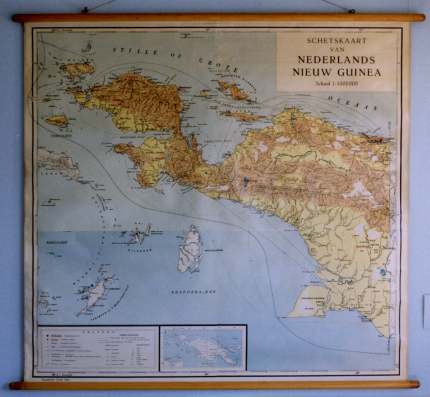
Figure 9. ‘Schetskaart van Nederlands Nieuw Guinea’, 1953, published by J.B. Wolters, 130 x 139 cm, scale 1 : 1.000.000.
J.B. Wolters, one of the leading publishers in The Netherlands of school books and maps, based in Groningen but since 1920 also in Batavia (Djakarta), was the first to respond to the growing demand for maps of Netherlands New Guinea. In 1953 Wolters published the ‘Schetskaart van Ned. Nieuw Guinea’ (see Figure 9). Though Wolters was one of the few publishers with an own ‘Cartografisch Instituut’, in 1953 this wall map had to be produced by the ‘Topografische Dienst’. Unsurveyed regions are indicated by white areas on the map, a feature which is very uncharacteristic of school wall maps. Furthermore, the large number of details is characteristic of ‘Topografische Dienst’ maps, but usually undesirable on a school wall map.
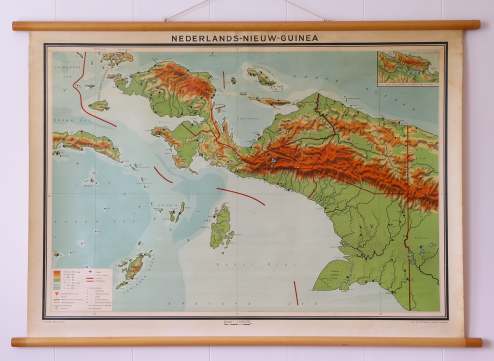
Figure 10. ‘Nederlands-Nieuw-Guinea’, by P. Eibergen and E. Penkala, 1956, published by J.B. Wolters, 77 x 110 cm, scale 1 : 1.500.000.
In 1956, however, Wolters published a school wall map of Netherlands New Guinea, which was entirely ‘home-baked’ (see Figure 10). In every respect this is a very professionally made and functional school wall map: a modest amount of cartographic information, a vivid representation of the relief, up-to-date and a high map fidelity. Understandably, economic aspects are omitted on this general map. However, (primary) schools could obtain a thematic school wall map titled ‘Ned. Nieuw Guinea’ from Dijkstra (see Figure 11), a publisher of a very successful socio-economic geography method of Bakker and Rusch, which uses child-friendly economic pictorial symbols [6]. The administrative transfer of the western part of New Guinea to Indonesia in 1963 definitely ended the Dutch presence in the region, and as a consequence abruptly made the school wall maps of Netherlands New Guinea useless and worthless.
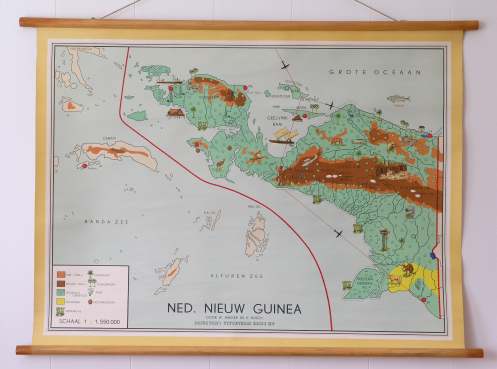
Figure 11. ‘Ned. Nieuw Guinea’, by W. Bakker and H. Rusch, 195x, published by Dijkstra, 79 x 107 cm, scale 1 : 1.550.000.
SURINAM AND THE NETHERLANDS ANTILLES
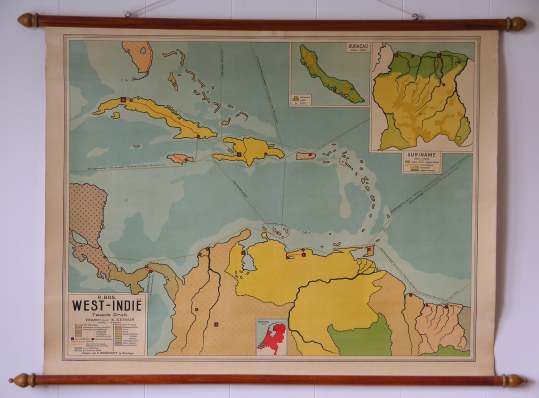
Figure 12. ‘West-Indië’, by R. Bos and K. Zeeman, 1928, 2nd edition, published by P. Noordhoff, 83 x 112 cm, scale 1 : 4.000.000.
After the political troubles in the Dutch East Indies / Indonesia settled down in 1949, the somewhat neglected Dutch West Indies suddenly found themselves in the spotlight. The lack of ((school) wall) maps of Surinam and of the six islands which make up the Netherlands Antilles became clear. The few school wall maps of these areas which did exist before 1950 were not very useful [1]. An example is given in Figure 12. This map of the West Indies contains two much too small auxiliary maps of Surinam (scale 1 : 2.000.000) and of the main island of the Netherlands Antilles, Curaçao (scale 1 : 300.000).
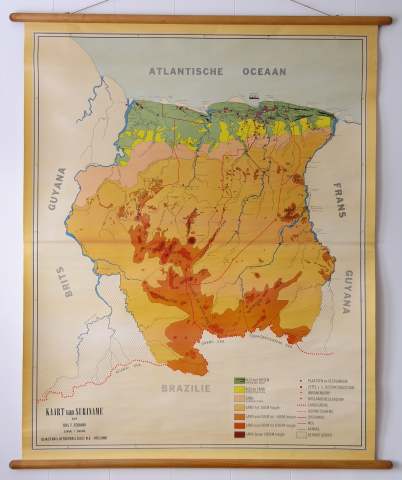
Figure 13. ‘Kaart van Suriname’, by F. Ferrari, 1955, published by Dijkstra, 148 x 116 cm, scale 1 : 500.000.
However, after 1950 the risen level of Dutch school cartography also became apparent in the published school wall maps of Surinam. The map of Ferrari (1955) shown in Figure 13 is probably the first example of this. The clarity of the map is good, and the relief representation with hypsometric layers only is simple but effective. A disadvantage is the use of soil type colours (coastal zone) and hypsometric colours (inland) on the same map. The representation of the relief of Surinam on the school wall map published by Wolters (see Figure 14) is more realistic and more consistent (hypsometric colours and hill shading for the whole of Surinam). From comparing Figure 14 with Figure 10 it can be seen that both school wall maps originated from the same maker: ‘Cartografisch Instituut J.B. Wolters’.
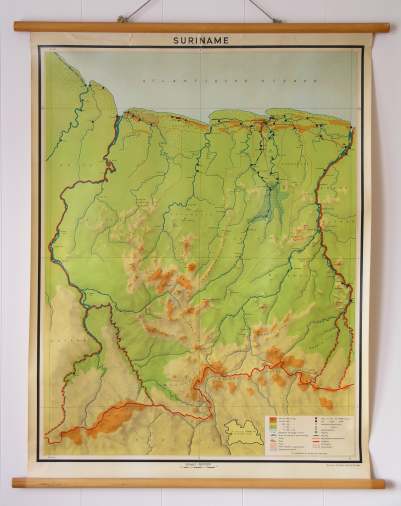
Figure 14. ‘Suriname’, 1958, published by J.B. Wolters, 108 x 84 cm, scale 1 : 600.000.
CONCLUDING REMARKS
The above shown examples of school wall maps illustrate the variety and richness of Dutch school cartography in the 19th and 20th century. However, as demonstrated in the paragraphs ‘relief representation’ and ‘map fidelity and up-to-dateness’, the quality of the school wall maps (and, though not shown, also of the school atlas maps) can vary considerably. Due to the lack of cartographic training-facilities the latter is especially true for school wall maps published before 1950, and, hence, for the school wall maps of the Dutch East Indies (almost always published between 1875 and 1950). As the school wall maps from this period were often produced by self-taught, stubborn and independently working school teachers, cartographic developments are hard to distinguish in this relatively short period. The most visible trend is the appearance from about 1900 of simple and clear school wall maps, that can be used at a distance.
After 1950 the design of school wall maps ceased to be an additional job of school teachers and was gradually taken over by professional cartographers (for instance the ‘Cartografisch Instituut J.B. Wolters’). This is noticeable in the higher quality of the school wall maps of Netherlands New Guinea (period 1950-1962) and of Surinam (since 1950).
REFERENCES
1. Brink, L.E.S. and L.M.A. Holl, De wereld tussen twee stokken: De geschiedenis van de Nederlandse schoolwandkaarten. - Nijmegen, 2005. - Chapter I.
2. Brink, L.E.S., De Schoolkaart van Insulinde van R. Schuiling: Een overzicht van de Indische cartografie in 1898 op vijf m˛. - In: Caert-Thresoor 25 (2006), 1, p. 13-19.
3. Ormeling, F.J., Biografie van de Bosatlas: 1877-heden. - Groningen, 2005. - p. 19.
4. Raisz, E., General cartography. - New York, 1948. - p. 220.
5. Noordhoff, R., De kaart als grondslag van het onderwijs in de aardrijkskunde. - Amsterdam, 1902.
6. Brink, L.E.S. and L.M.A. Holl, Schoolkaarten vol plaatjes: Aardrijkskunde-onderwijs met de methode Bakker en Rusch. - In: Boekenpost 13 (2005), p. 40-41.
|